A Data Story (a discovery, and a collaboration one as well)
How important data and collaboration is to discover a needle in a haystack
Introduction
I don’t know where this post is going to go. But my goal is to tell a powerful experience I had with a product analyst that hopefully will inspire you to connect with them more often, understand how to approach an analysis from scratch, and help you in the discovery process.
Let’s see where this goes.
Context
As responsible of Search feature in a marketplace, we have a mission that is:
Empowering buyers to effortlessly find and compare ideal resources.
If we do our job well, we will see that more people engage with materials, therefore there will be a high probability that they end up buying or downloading our materials; that will motivates authors to upload more materials, then the company will generate revenue. In more simplistic terms, if we are not able to feed buyers with relevant materials, we have no business whatsoever.
Analysis
Problem
When I arrived at eduki, one of the missions I was assigned to was “let’s improve the performance of our search algorithm”.
The first question I got was, where the hell do I start from?
But that was the wrong question to ask at the time.
The question should have been what improve, performance, and search algorithm means? and then, Where do I start from?
A mission could be several problems in disguise. Break them down to gain more clarity what part you want to tackle first.
Let’s break each piece down:
Improve
In order to improve something you must understand the state of the art. The used a racing car analogy to explain this point. If you are part of the Formula 1 engineering team of Ferrari, and they make you responsible for improving the car performance, you need to look at the entire system first.
By doing so, you will understand the parts, how they interact among each other, and what is even more important, which parts you can tweak now and get some quick wins (improve the lap velocity by seconds) and some long-term things (let’s make our team into the podium next season).
It is obvious that this representation is not static. My first graph was much more basic than this one. You keep rinsing and repeating as you are learning and getting more knowledge and expertise.
Tip: this is something I did myself first and to be honest it serves as a conversation started. When you show those to folks, they tend to fill the gaps, and you learn much faster.
ProTip: If you can have some external feedback with someone who worked in the field, even better. I was lucky of being introduced an engineer who worked in search for many years. Now I made it a monthly call, where we talk about topics and search trends.
the Performance
Once you have the understanding of the system, it’s time to measure and defining metrics. They both seem the same but they are not. Please read this short series on 7 Principles for Product Instrumentation Success from
where he explains the difference between measurement and metrics.As you can see, I’ve started describing the questions that I need to answer and then see how they are playing with each other, and what KPI is relevant to capture that connection. This may be different for someone who has experience in the field, or is in a position where they only care about the KPI (not my case though).
The previous picture serves at three purposes:
Generate a better understanding the difference pieces of the engine and how they connect to each other.
Easily determine what are the most relevant indicators to work on when you define the mission of your team, and how they connect to revenue.
Gaps you need to fill to get a better picture and know if you are having success with your initiatives. The things highlighted in red, were the things that initially we couldn’t measure, therefore some questions remained unanswered.
ProTip: If you can draw the flywheel of your own product once you know the different input metrics, it will help you a lot to understand what things you need to monitor and check when you want to influence certain behaviors.
of the Search Algorithm
I had to learn how to decompose a search algorithm and understand the different pieces that make off the product. But guess what, because we did our homework in the previous pieces, I had a rough sketch of how the things were working, even if it was not perfect, it was good enough.
Collaboration
But nonetheless, Where do we start looking at? What is the hole we should dig first? Three things that sound obvious, but I never stop repeating:
Make sure the person you are working along had the previous context. The system, metrics, questions, everything so you both speak the same language (starting point).
Restate the mission (destination) so it is clear where we are going.
Be honest stating that you don’t know the path, you are there to discover and learn (path or process).
This is where we came back to first principles. We ask ourselves, “What do we know now?” Well we knew that our algorithm was performing worst against our competitor’s one (via A/B testing). We started there. No magic framework, no weird recipe pulled from a book, just being curios of what we have now.
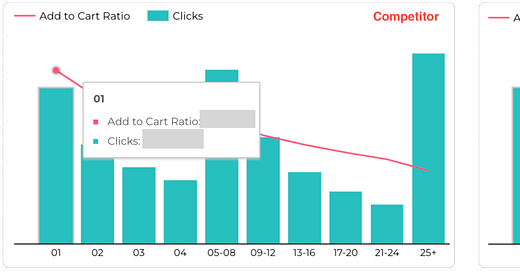
Then we follow what I call “pulling the thread” to see what we got. We saw that our competitor was performing well, but not for much (unfortunately I cannot show the real numbers). This is were we need to be very careful to not focused only on revenue, since that’s the consequence of many other actions. Here is how the conversation went (I’ll preserve the name of the product analyst by calling him Nicholas):
Fede: "Ok, what is the earliest sign we could measure to see some user intent?”
Fede & Nicholas: “Search queries” we both screamed out loud.
Nicholas: “Fede, bad news, we are not tracking that event. But we do have the search results, the position each result appeared on, and we can differentiate it by the search engine (competitor and us)”.
Fede: “That’s not bad, even if we cannot know the query that generated the results, we can see the characteristics of the results. What can we know from the search results?”
Nicholas: “We track the clicks for each position and the add-to-cart ratio.”
Fede: “Great, that would be a good for enough starting point”.
Nicholas: “Wow, this is very interesting. Even if they perform better, we have a better add-to-cart ratio.”
Fede: “What? Are you serious? How is that possible?” - Here we had two options. We could see the effects downstream (dig at the AOV level) or upstream (still digging into the results). We stuck at the upstream level.
Nicholas: “The other element we have from results is the price. Let me see if there is something there.”
Nicholas: “Boom, I think I found an interesting thread to pull. Here is the head-to-head comparison of the prices for each position. They are having on average 15% higher prices in the first 8 positions.” What a coincidence that those positions are the ones with higher clicks and add-to-cart ratio.
I’m going to stop here, but you probably get the point. It took us ~4 hours in total, we have split in two sessions, and we end up the analysis with a testable hypothesis and more avenues we could explore (AOV, number of transactions, type of materials…). What I mean is that, this was not a transactional exercise, where I needed something, the analyst do it and gave me the data, I thought about it on my own, got back to him, ask another thing and so on. We were discovering things and complementing our knowledge together as we kept digging. These moments feel magical and are much more productive than doing it on each others' own.
Then, we gave each other different task to complete separately. We defined the next steps on the analysis, and when we would need to get together again (if necessary). I won’t get fed up of repeating this, the act of collaborating might be difficult at the beginning, but it is worth trying it out.
Conclusion
Don’t jump straight into a mission without stepping back and look at the problem and its own pieces. The bias for action, could have an impact on the opportunity cost. You should be focusing on another part of the problem that is more important.
In this particular case, the collaboration with a product analyst made me go 10x faster. Identify those areas where having a partner in crime could exponentially increase your outcome and velocity and stick to it.
Do your homework and don’t be ashamed. My responsibility is to understand what are the problems that are worth to be solved. If you found a problem and then you bumped into something bigger, build your hypothesis with the data at hand, make the case for it, and get feedback from your stakeholders.
Get your hands dirty. In order to go even faster, I had to do my analysis as well. I couldn’t believe how fast I was able to get insights myself with the help of ChatGPT and Claude. There are no more excuses like “I have no one from the data team helping me”.
Don’t collaborate for the sake of it. Do it when there is a valid reason for it. Explain the context, outcomes, and be honest when you don’t know things. It will help you to know when to slow the analysis down, and when to go faster.


